Running tests with Visual Studio
The Visual Studio IDE adds value by providing specialized windows for running and analyzing tests. Additionally, it is capable of displaying debug output emitted by the CNG Engine components.
Test Explorer
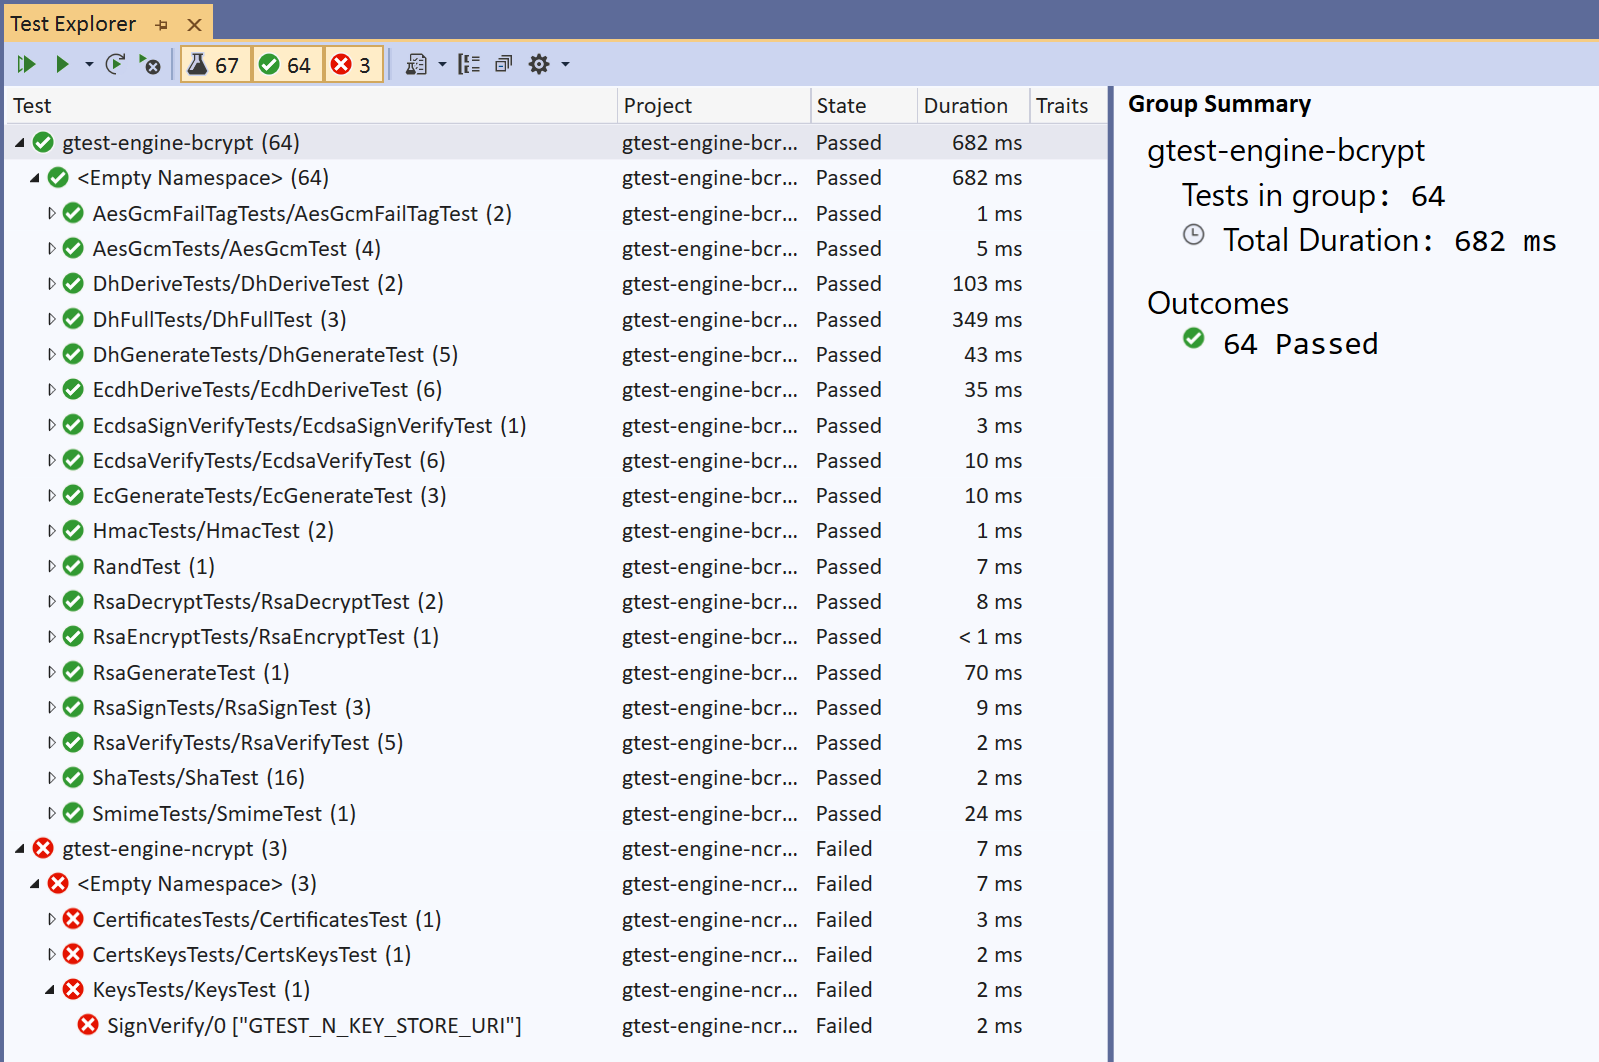
The Test Explorer is a window that can be opened via the Test → Test Explorer menu item. It is a visual interface into the functional test results, provided by the GoogleTest framework in conjunction with the Google Test Adapter. It is also capable of starting (and interrupting) any (collection of) defined test cases.
Code Coverage
The Enterprise edition of Visual Studio is capable of determining code coverage as well, via the Test → Analyze Code Coverage for All Tests menu item.
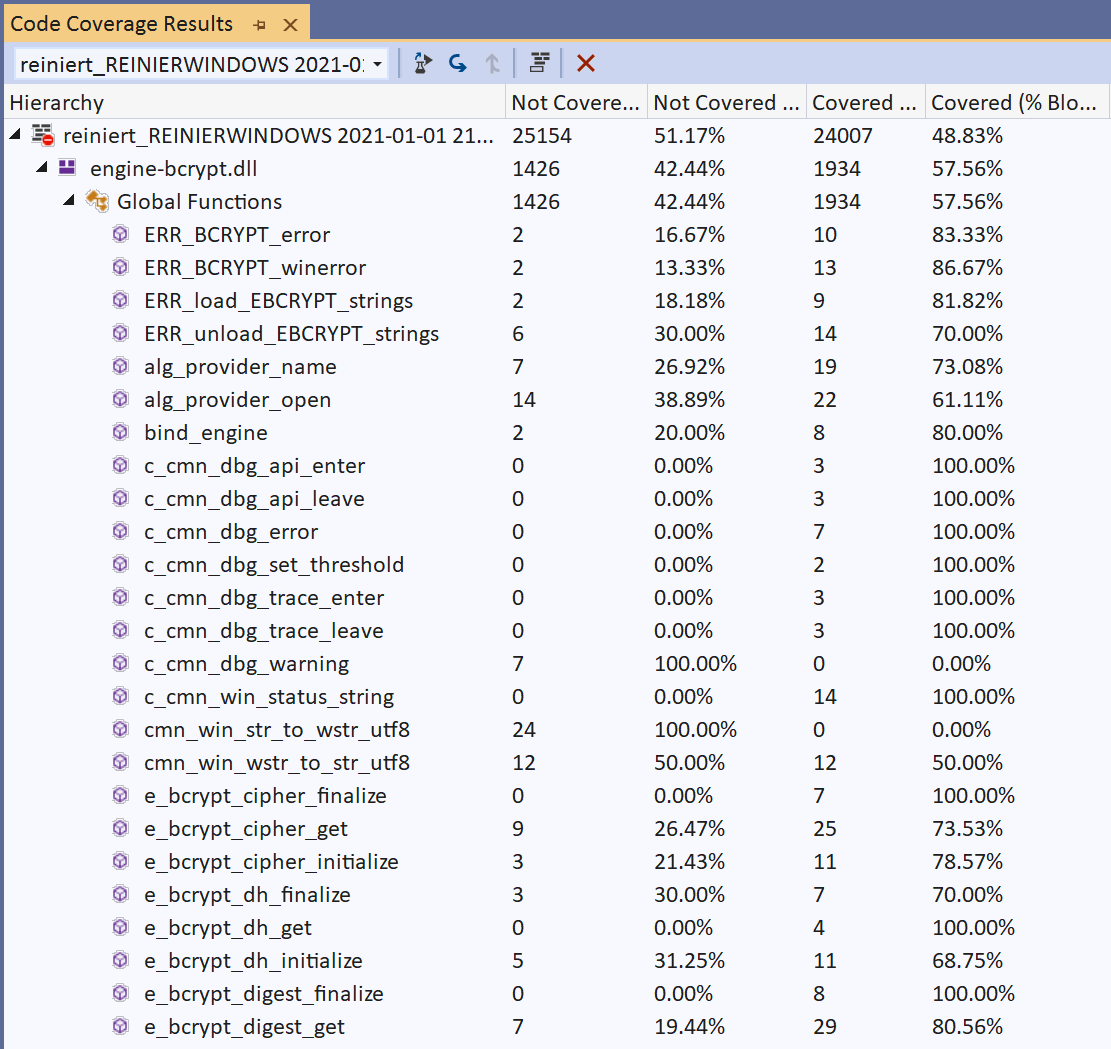
Note that the code coverage percentage is currently low due to the large amount of failure branches that have not been hit.
Running in the Visual Studio debugger
The functional tests can easily be run in the Visual Studio debugger as well. The project is already set up to include the projects’ target directory in the PATH and all binaries required to run should be available.
When running in the debugger, debug messages may be emitted and show up in the Output window, for example like this:
error: Win API: BCryptVerifySignature failed (0xc000a000, "The cryptographic signature is invalid."): Verifying signature with RSA key
These are (double-)clickable messages that allow for navigating to the associated source code line. For more information on debug messages, see section Debugging.